Author: Southwest Utah Public Health Department

Long term wellness is achievable for every individual. From simple self-assessments and local nutrition programs to structured lifestyle classes and clinical referrals, discover how you can utilize existing resources to transform wellness across Southwest Utah.
.png)
Whole-person health is built at the intersection of our daily habits and the environments we inhabit. While community conditions—like socioeconomic factors and physical surroundings (reflected in the Healthy Places Index to the right)—shape our access and opportunities, our everyday personal choices in nutrition, movement, sleep, stress management, and preventive care remain powerful drivers of our health.
Where we live sets the foundation, but how we live builds our future. By pairing supportive community environments with individual, small-scale lifestyle shifts, we unlock our highest-leverage opportunity to prevent chronic disease and cultivate lasting wellness across Southwest Utah.

Across our 5-county region, adults aged 65 and older represent over one in five residents (20.7%), with rural counties like Kane and Garfield reaching 24.5%—nearly double the state average. This demographic evolution underscores the urgent need to prioritize chronic disease prevention, promote healthy behaviors, and support healthy aging across our communities. (U.S. Census Bureau, 2018–2022 American Community Survey 5-Year Estimates, Tables S0101 & DP05.)
The map illustrates the regional distribution of adults age 65 and older, ranging from lower concentrations in light blue to higher concentrations in dark purple.

Checking in on your physical activity is one of the easiest ways to start your wellness journey. Use the PAV Physical Activity Vital self-assessment to measure your weekly movement in three quick steps:
- How many days a week do you engage in active movement (e.g., fast walking, cycling, or swimming)?
- How many minutes do you spend exercising on those days?
- Calculate your score: Multiply Days x Minutes to see if you hit the target of 150 minutes per week. (Plus: Are you including muscle strengthening 2+ days a week?)
Discover your score today. Whether you're at 20 minutes or 120 minutes, every extra step brings you closer to long-term health.
The map on the right shows adult obesity rates across Utah cities and towns, with lower rates represented in light blue and higher rates in dark purple.

Even small amounts of daily vigorous movement can dramatically lower the risk of heart disease, cancer, and premature death. Beyond long-term longevity, regular activity transforms daily life—boosting energy, reducing stress, and improving sleep and mobility. To help our community harness these benefits, several local, low-barrier programs are available:
- Strong Bodies (USU Extension): A 12-week progressive strength and balance training program optimized for adults 40+.
- Park Rx America: Personalized nature prescriptions that encourage outdoor movement, active living and stress reduction.
- Defying Gravity: A 90-minute fall prevention class focused on buildng strength, improving balance and enhancing home safety.
- Healthy Aging A variety of evidence based community workshops designed to help older adults live well and stay independent.
The map on the right uses colors from light blue to dark purple to show which counties have low to high rates of adults who do not exercise or participate in physical activities.

Only about 1 in 10 adults eat the recommended amount of vegetables and fruits each day. Eating healthier reduces the risk of chronic disease and supports energy, mood, digestion, and better sleep.
- How many times a week did you eat fast food meals or snacks?
- How many servings of fruit did you eat each day?
- How many servings of vegetables did you eat each day?
- How many regular sodas or glasses of sweet tea did you drink each day?
- How many times a week did you eat beans, chicken, or fish?
- How many times a week did you eat regular snack chips or crackers (not low-fat)?
- How many times a week did you eat desserts and other sweets (not low-fat)?
- How much margarine, butter, or meat fat do you use to season vegetables or bread?
These questions are part of the 'Starting the Conversation' Diet Screener- How did you do?
Supermarket access for cities and towns ranges from lower concentrations in light blue to higher concentrations in dark purple.
(Lee SH, Moore LV, Park S, et al. Adults Meeting Fruit and Vegetable Intake Recommendations — United States, 2019.)

There are several key programs & services that help us expanding food access and nutrition education across Washington County and the region through local partnerships:
- Retail Nutrition Coaching: Free 1-on-1 Nutrition Health Coaching at Natural Grocers and dietitian-led store tours at Harmons.
- Food Access: Utahns Against Hunger
The map on the right shows food insecurity rates across Utah counties, with lower rates represented in light blue and higher rates in dark purple.
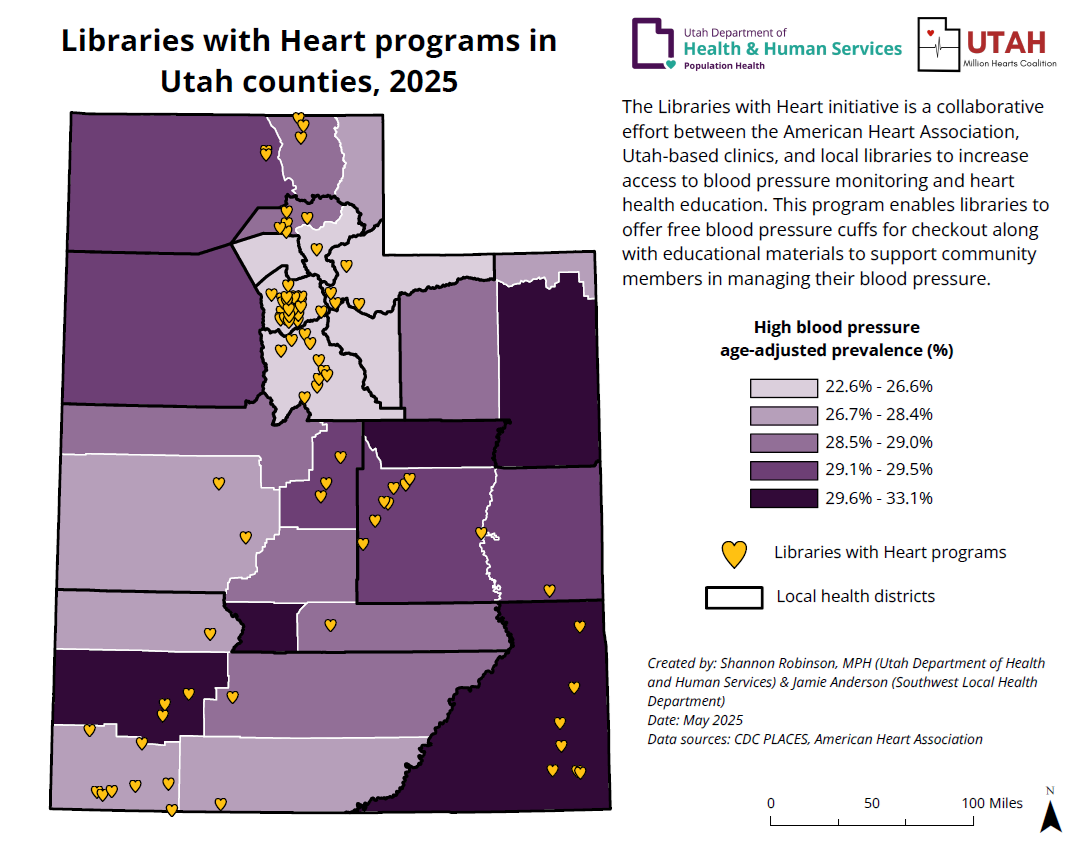
Because daily habits are shaped outside clinic walls, empowering individuals with practical skills is our first step in reversing regional chronic disease trends. Every journey toward diabetes and hypertension management begins with awareness and accessible, low-barrier education.
- Building Practical Nutrition Skills: Through free programs like Intermountain Health’s 2-hour Prediabetes 101 (available in English and Spanish) and the interactive USU Extension Diabetes Cook Along, community members gain hands-on practice with the Diabetes Plate Method, grocery shopping on a budget, and preparing produce-rich meals.
- Expanding Community Screening: Initiatives like Libraries with Heart make self-measured blood pressure (SMBP) monitoring accessible to everyone by placing free cuff lending kits directly into local public libraries—connecting daily self-checks to routine clinical care.
The map shows adults in cities and towns with high blood pressure, ranging from lower concentrations in light blue to higher concentrations in dark purple.

Substance and tobacco use directly impact physical, mental, and social well-being. Choosing a nicotine- and substance-free lifestyle is a powerful step to protect heart health, lower chronic disease risk, and extend longevity. Building a healthier community begins with equipping residents with accessible, supportive tools to overcome addiction and sustain lasting change:
- Way to Quit Services: Connecting Utah residents to free, evidence-based tobacco and vaping cessation support—including personalized coaching, nicotine replacement therapy (NRT), and online quit tools. Youth services at My Life My Quit.
Adult smoking rates across Utah are shown on the map, with lower rates represented in light blue and higher rates in dark purple.

Moving from initial awareness to lasting health outcomes requires structured, long-term support and a closed-loop network of community resources. Once individuals identify their risk or diagnosis, we connect them to evidence-based pathways designed to sustain whole-person health.
- Patients can access intensive, evidence-based interventions including the 1-year National Diabetes Prevention Program (DPP) to achieve target weight and activity goals.
- DSMES and Medical Nutrition Therapy (MNT), provides up to 10 hours of diabetes self management education and 2 hours every year thereafter.
- Living Well Workshops is an accredited and free 6-week peer-led class for managing diabetes and chronic conditions.
- Utahinsulin.net Helps individuals without health insurance or with high deductibles cover insulin costs
Diagnosed diabetes rates for cities and towns are illustrated by lower concentrations in light blue to higher concentrations in dark purple.
.png)
Where we live shapes our baseline, but daily health choices account for 30% of overall wellness outcomes. Southwest Utah bridges the gap between public health and daily living by connecting residents to evidence-based, low-barrier tools—including active aging strength classes, free retail nutrition coaching, library-based blood pressure kits, and accredited diabetes management programs. Although Healthy Places Index (HPI) scores vary across our five counties, we can drive down chronic disease and build a healthier, more active region together—right from where we stand.
Walkability scores for cities and towns are illustrated by lower concentrations in light blue to higher concentrations in dark purple.
(University of Wisconsin Population Health Institute. County Health Rankings & Roadmaps.)